Working with PySWMM#
If we really want to supercharge our modeling workflow, we can tap into the excellent functionality provided by pyswmm.
Note
pyswmm and swmmio | what’s the difference?
Generally speaking, we can use pyswmm to interact with the running simulation, implement control logic in Python, and edit of network and hydrologic parameters, all of which can be done without manipulating the *.inp file.
In contrast, swmmio provides functionality to read the *.inp and *.rpt files and manipulate the *.inp files, which is useful for programmatically generating models, post-processing results, and extracting model data for use in other applications.
We won’t get into the details of pyswmm here (see the official pyswmm docs for that). Here we’ll walk through a simple example that runs a model with pyswmm and post-processes the results with swmmio.
Instantiate a swmmio.Model#
We’ll start by instantiating a swmmio.Model with a model hosted in the swmm-nrtestsuite repo.
from IPython.display import HTML
import swmmio
import pyswmm

# path to a SWMM model from swmm-nrtestsuite
model_path = 'https://raw.githubusercontent.com/USEPA/swmm-nrtestsuite/refs/heads/dev/public/examples/Example1.inp'
model = swmmio.Model(model_path)
model.summary
{'num_subcatchments': 8,
 'num_conduits': 13,
 'num_junctions': 13,
 'num_outfalls': 1,
 'num_raingages': 1,
 'catchment_area': np.int64(71),
 'mean_subcatchment_slope': np.float64(0.010000000000000002),
 'total_conduit_length': np.int64(4300),
 'invert_range': np.int64(35)}
Extract links flows pyswmm.Simulation#
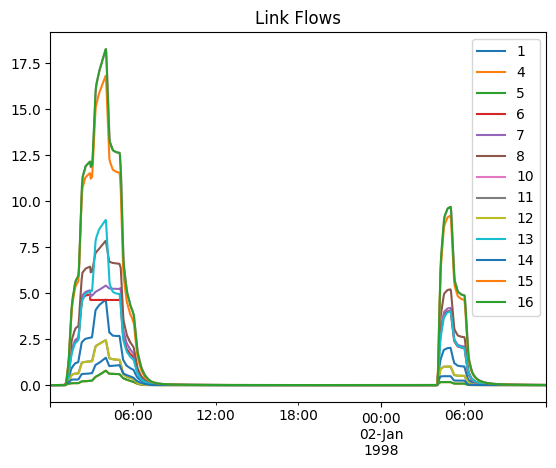
Next, we’ll open a pyswmm.simulation.Simulation context to run the model. At each simulation step, we’ll store the flows at each link, using swmmio to refer to each link id. When the simulation is done, we’ll plots things in a simple timeseries chart.
import pandas as pd

link_flows = dict()

# Run simulation PySWMM
with pyswmm.Simulation(model.inp.path) as sim:

  # get link ids
  link_ids = model.inp.conduits.index

  for step in sim:
    # store each link's flow in a dictionary
    link_flows[sim.current_time] = {
      link_id: pyswmm.Links(sim)[link_id].flow
      for link_id in link_ids
  }

pd.DataFrame(link_flows).T.plot(title='Link Flows')
<Axes: title={'center': 'Link Flows'}>

Animating Link Flows#
Let’s turn our post-processing up a notch by animating the flows in the network:
import matplotlib.pyplot as plt
import matplotlib.animation as animation

# Create a links geodataframe and join the flow data
links_gdf = model.links.geodataframe
links_gdf = links_gdf.join(pd.DataFrame(link_flows))

# create a figure and axis
fig, ax = plt.subplots()

# Function to update the plot for each frame
def update(frame):
    ax.clear()
    links_gdf.plot(linewidth=links_gdf[frame]+0.2, ax=ax, capstyle='round')
    ax.set_axis_off()
    ax.set_title(f'{frame}')

# Create the animation
ani = animation.FuncAnimation(fig, update, frames=list(link_flows)[30:400][::5], repeat=True)

# Close the figure to prevent it from being displayed
plt.close(fig)

# render the animation in the notebook
HTML(ani.to_jshtml(fps=30))